
This is a program that enables the user to input the coefficients of a cubic function and draw its graph. The cubic function takes the form f(x)=ax3+bx2+cx+d. We need to create the cubic function with some modifications. The coordinates in computer screen starts from top left, therefore instead of x we used a certain number to substract x. As we define the width of the graph as 10, so we use 5-x so that the graph starts plotting from the center. In VB, the cubic function takes the following form:
Private Function f(x As Variant)
f = a * (5 - x) ^ 3 + b * (5 - x) ^ 2 + c * (5 - x) + d
End Function
To draw the graph, we use built-in function PSet.
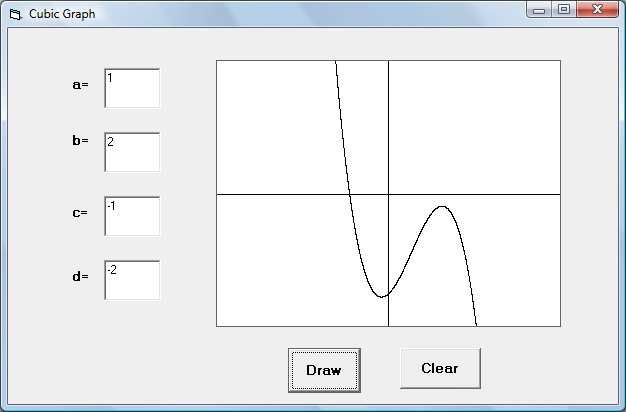
In this program, you need to insert four text boxes for the user to enter the four coefficients, a picture box and two command buttons, one is to draw the graph and the other one to clear the inputs. Name the picture box as pic_graph, the draw button cmd_draw and the clear button as cmd_Clear. The runtime interface is shown in the Figure below:
Dim a, b, c, d As Integer
Dim x As Double
Private Function f(x As Variant)
' Need to make some transformation as the left coordinates in VB start from left
' our graph starts from center
f = a * (5 - x) ^ 3 + b * (5 - x) ^ 2 + c * (5 - x) + d
End Function
Private Sub cmd_Clear_Click()
pic_graph.Cls
txt_a.Text = ""
txt_b.Text = ""
txt_c.Text = ""
txt_d.Text = ""
End Sub
Private Sub cmd_draw_Click()
Dim y As Double
Dim w As Double
a = Val(txt_a.Text)
b = Val(txt_b.Text)
c = Val(txt_c.Text)
d = Val(txt_d.Text)
'Using a scale of 0.5 cm to represent i unit to draw the graph
' Need to make some transformation as the coordinates in VB start from top left
For w = 0 To 10 Step 0.0001
y = f(w)
pic_graph.PSet (w, 5 - y)
Next w
Copyright©2008 Dr.Liew Voon Kiong. All rights reserved |Contact|Privacy Policy